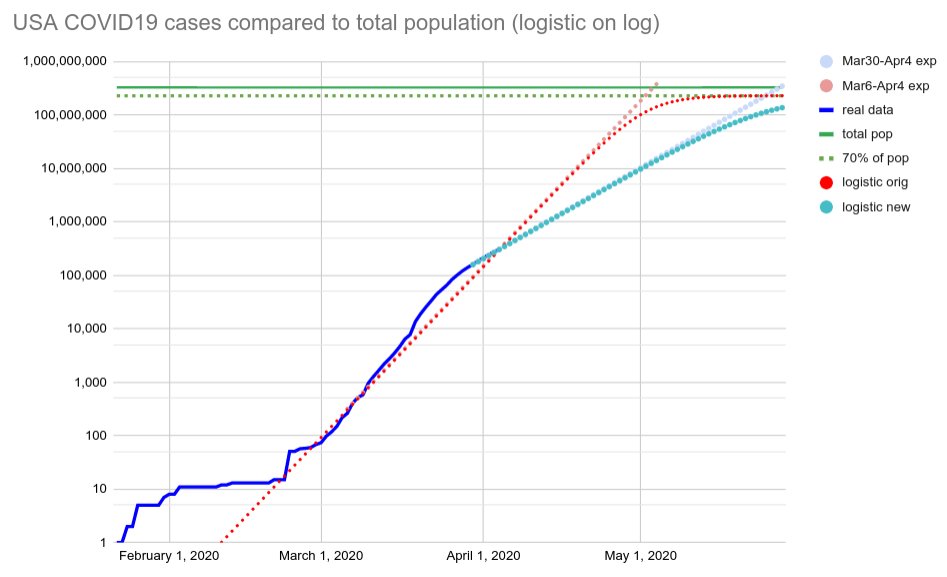
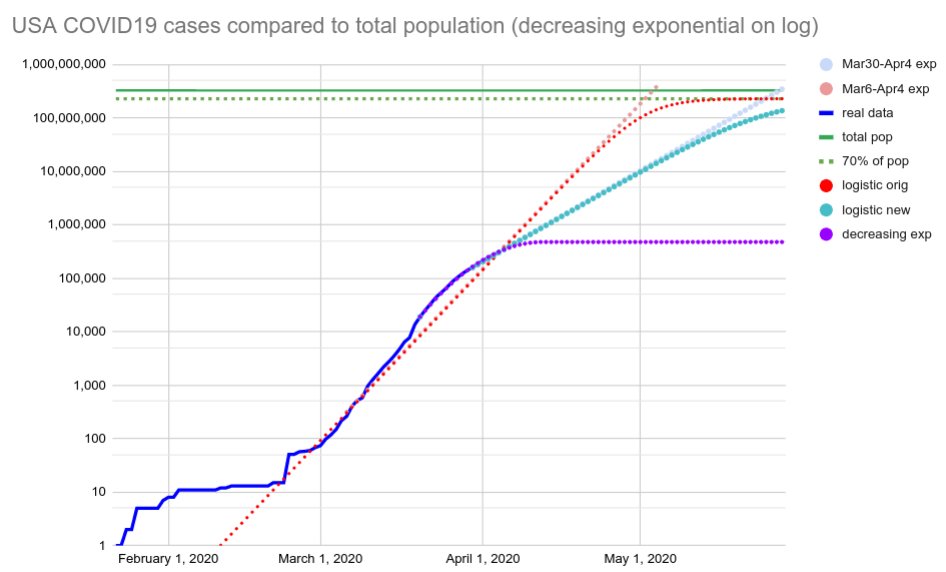
Idea 💡 Show logarithmic growth charts with the total population indicated as well. eg for USA - 10^8.5 people total - 10^5.5 confirmed cases now - 10^2.5 confirmed cases a month ago at that rate, would max out May3 at current rates, would max out May28 ofc, won't stay exp